|
Weather Eye with John Maunder |
The latest global average temperatures of the troposphere – those observed from US National Oceanic and Atmospheric Administration satellites – are computed by the University of Alabama at Huntsville in the United States.
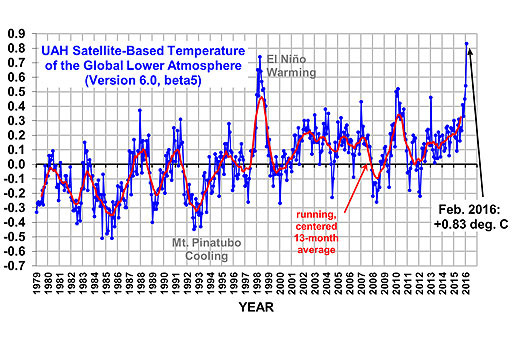
The above chart shows that since 1979, when reliable satellite observations became available, there has been little overall trend from the average temperatures during the 30-year period from 1981-2010 in the tropospheric temperatures, apart from a period of somewhat warmer temperatures since about 1997, and two significant warm periods associated with the El Nino events in 1998 and 2015-16.
The troposphere is the lowest layer of Earth's atmosphere.
It contains approximately 75 per cent of the atmosphere's mass and 99 per cent of its water vapour and aerosols.
The average depth of the troposphere is approximately 17 km in the middle latitudes.
The tropospheric temperature data for 2011 is January 0.0 degrees Celsius, February -0.02, March -0.10, April +0.12, May +0.14, June +0.32, July +0.38, August +0.33, September +0.29, October +0.12, November +0.12, December +0.10 degrees.
The data for 2012 is: January -0.09 degrees, February -0.12, March +0.11, April +0.29, May +0.29, June +0.37, July +0.28, August +0.34, November +0.28, December +0.20 degrees. The data for 2013 is: January +0.50 degrees, February +0.18, March +0.20, April +0.10, May +0.07, June +0.30, July +0.17, August +0,16, September +0.37, October +0.29, November +0.19, December +0.23 degrees.
The data for 2014 is: January +0.30 degrees, February +0.18, March +0.17, April +0.19, May +0.33, June +0.31, July +0.30, August +0.20, September +0.30, October +0.37, November +0.33, and December +0.33 degrees Celsius.
The data for 2015 is: January +0.20 degrees C, February +0.18 degrees C, March +0.14 degrees C, April +0.07 degrees C, May +0.30 degrees C, June +0.32 degrees C, July +0.18 degrees C, August +0.22 degrees C, September +0.20 degrees C, October +0.32 degrees C,. November +0.40 degrees C, and December +0.48 degrees C.
The data for 2016 is: January +0.55 degrees C, and February +0.83 degrees C.
The coolest months since 1979 were September 1984, with minus 0.49 degrees Celsius, and November 1984, with minus 0.42 degrees Celsius.
The warmest months were February 2016 with plus 0.83 degrees C, and February and April 1998, both plus 0.76 degrees Celsius.
The chart shows the El Nino warming in the 1998 period, and 2015-16 periods, and the Mount Pinatubo, volcanic cooling during 1992-1993.
For further information on a range of weather and climate matters see: https://sites.google.com/site/climaterisksandbenefits/