|
Weather Eye with John Maunder |
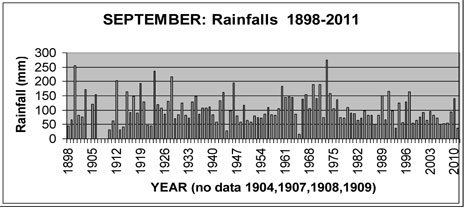
Rainfalls for the month of September have been recorded in Tauranga since 1898, except for 1904, 1907, 1908, and 1909.
The graph shows the range of rainfalls from an extreme high of 274mm in 1973 to a low of only 16mm in 1965. The second wettest September was 1900 when 256mm was recorded, and the second driest September was in 1944 when only 27mm fell. The long-term average rainfall for Tauranga for September is 106mm.
The graph of the September rainfall shows normal variations from year to year. There is a very small decrease in the average of the September rainfalls during the last 50 years (1961-2010) from an average of 103mm, compared with an average of 105mm during the 50 years from 1911-1960. This is similar to the months of January, February, April, May, June, July and August during the same periods, which also show small decreases in the overall rainfalls during the last 100 years, compared with a small increase in the March rainfalls. Since 1898, there have been five September months with a rainfall of 200mm or more (four of which occurred during the period 1900 to 1928, and only one September month since then), compared with six September months with a rainfalls of 40mm or less.
For further information, Google "Dr John Maunder".