


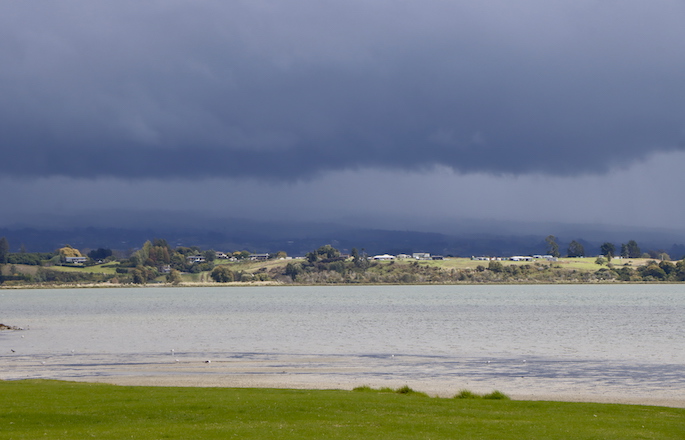
Many forecasts across New Zealand this week show a rain or thunderstorm symbol/icon - but sunny and dry weather may still dominate some places expecting to have rain or thunder.
Why does this happen? WeatherWatch head forecaster Philip Duncan explains below.
Basically the weather icon displayed in a forecast is to draw attention to what may be considered the main weather feature(s) of the day. 24 hours of weather boiled down into one small picture. Even if a thunderstorm only lasts 15 minutes out of an entire 24 hours, it may be considering the main feature of the day (and this is a constant debate with weather forecasters vs which icon should go up!).
Weather #icons only tell part of the forecast story!
— WeatherWatch.co.nz (@WeatherWatchNZ) December 18, 2022
This week you'll see plenty of weather icons. This is because downpours inland will be big & may track into nearby regions. It's worth noting that around these downpours it may well be .
Track daily on rain radar! pic.twitter.com/8txPvz2lWG
For many people, the weather icon is most or half of their forecast - but you need to read the "fine print" in the surrounding/supporting weather maps and data to really get the forecast that is most accurate. If this extra accuracy matters to you, or your business, then understanding and following the steps listed out below should help save you some frustration when the forecast doesn't pan out the way you expected based mostly on that icon.
This week a low pressure zone in the Tasman Sea is falling apart - but will take until Christmas Eve to do so. This system is very weak, but the moisture and instability it brings will be triggered by the summer heat and that means the risk for heavy downpours and thunderstorms.
In the cool of the morning this moisture in the lower atmosphere may appear as drizzle, a brief shower, or simply dry with just some morning dew or clouds. The afternoon heat creates sea breezes which pushes inland and that pushes moisture and warm air higher up into the atmosphere and starts triggering isolated but big downpours and thunderstorms. These then usually drift in one direction with the dominant sea breeze (and sea breezes in our two main islands can come in from all directions and converge/meet up inland somewhere).
The size of these downpours and all the moving parts with the various sea breezes means the daily thunderstorm/downpour risk area may be large - even if in reality the storms form in just one part of the region. Hence why you see the thunderstorm risk icon even though many days the more coastal centres (like Auckland and many other of our main centres) may be dry or sunny for much of the day.
HOW TO BETTER WORK OUT SUMMER THUNDERSTORM AND AFTERNOON DOWNPOUR RISKS
- Thunderstorm Risk maps show (in colour) which areas have highest risk of thunderstorm. If it's not yellow/red/orange then the risk isn't so widespread or high.
- Rain forecast maps (NEW thanks to Predictwind.com) allow you to compare two global models side by side (or just look at one) to see where the rain and downpours are most likely and the time it moves through / clears, simply by using the slider to animate it.
- MetService Thunderstorm Outlook generally shows which regions are most at risk and which have lowest or no risk (works well in tandem with the Thunderstorm Risk maps and rain forecast maps above)
- Hourly data (from WeatherWatch.co.nz or RuralWeather.co.nz or our App). This is really good for looking at general risk times later today or in the days ahead. The RuralWeather graphs in particular show risk times for the week ahead at just a glance. (the image used in this news story is a screenshot from RuralWeather.conz).
- ON THE DAY: Best way to track downpours and the biggest downpours most likely to contain thunderstorms and hail is by using the Live Rain Radar (updates every 7.5 minutes).
- Also, our daily weather videos usually explain any risks across the year (please note our videos end this Friday for summer holidays, returning mid-January).
-WeatherWatch.co.nz head forecaster Philip Duncan

0 comments
Leave a Comment
You must be logged in to make a comment.