The Coromandel population has cracked the 30,000 mark, according to the latest data from our economic consultant Infometrics.
Since the 2018 census data came out in September, Infometrics has revised up its population count, and its September quarter analysis of our region now suggests a permanent Coromandel population of 31,500, a rise of 2.3 per cent on the year earlier.
That's significantly more people than we thought, says Thames-Coromandel District Mayor Sandra Goudie.
"Wonderful news. This shows more people want to live in our beautiful part of the world - and why wouldn't you?" Sandra says.
But while there are more of us choosing to live here, our population growth speed is starting to slow. Health enrolments in the area, an indicator of permenant population growth, increased just 1.4 per cent in the year to September 2019 – that's half the rise we had a year ago.
Infometrics senior economist Brad Olsen says slower population growth is one reason for our slowing local economy, where gross domestic product (GDP) grew just 1.4 per cent for the year to September, compared to a rate of 2 per cent last quarter, and below the national rate of 2.4 per cent.
'These softer figures are also driven by lower household and business investment, even as tourism activity in Thames-Coromandel remains strong,” says Brad.
Consumer spending growth, measured by card data, also slowed to a rate of 8.5 per cent, down from 9.2 per cent in the previous quarter (June 2019).
'That aside, Thames-Coromandel's spending growth is still more than double the national average at 3.4 per cent."
Labour market remains tight
Despite weaker indicators for GDP, population and consumer spending, Coromandel still haven't seen a reversal in labour market fortunes.
Infometrics estimates the unemployment rate in Thames-Coromandel at 2.5 per cent – that's the eighth-lowest rate in New Zealand.
'Such a low unemployment rate demonstrates the tight labour market in the area,” says Brad.
'And that's reinforced by the fact that, even though Jobseeker Support recipients have also increased locally, the rise (7.3 per cent annually) is lower than the national average (10 per cent)," he says.
'Thames-Coromandel's unemployment rate peaked at 5.4 per cent in middle of 2012, so we have come a long way since then, and there are still strong employment opportunities in the area."
Another driver of our-stronger-than-national unemployment data is the fact most people who move to the district make sure they have employment before they move, says Brad.
Council recently commissioned a report: ‘Who creates the jobs in Thames-Coromandel – new or existing businesses?. It found our entrepreneurs are alive and well, with new businesses playing a lead role in job creation across the district. Lean more and link to the report here
Tourism
Tourism remains the district's strongest industry and a key driver of economic activity and jobs.
Over the September 2019 year, commercial guest nights in our district rose 6.4 per cent, putting the area in the upper third of local areas for guest nights growth.
Given these figures don't include private accommodation such as Airbnb, accommodation levels in the area are likely to be even higher.
Tourists visiting Thames-Coromandel are still happy to spend, with total (domestic and international) tourism spending rising 9.7 per cent over the year to approximately $407 million - the sixth-highest tourism spending growth rate in the country.
Sandra says this is strong growth for the winter months.
"Given the data was captured during our off-season, this is really pleasing and reflects the good job our Regional Tourism Operator Destination Coromandel has been doing with its winter campaigns.
'It also bodes well for the peak summer months up ahead, and with a long, dry summer forecast, we are likely to be in for another record-setting summer on the Coromandel,” she says.
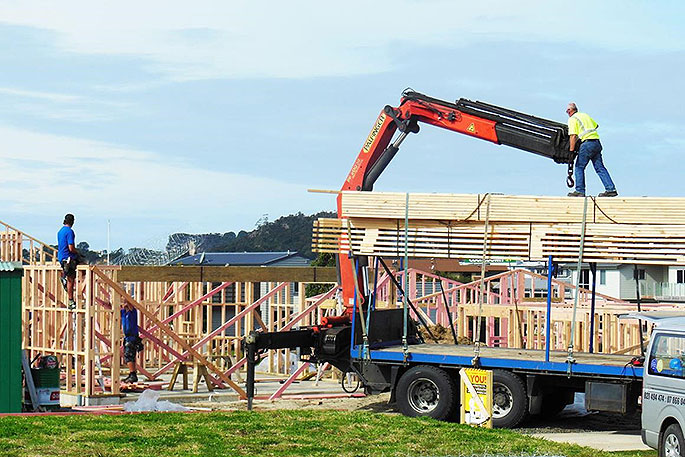
Building work echos population growth
Non-residential (commercial) building consents to the value of $22 million were issued in our district over the last year, a rise of 26.4 per cent, more than double the national average of just 12.7 per cent and well above our own 10-year average of 14.1 per cent.
The larger of these consents were issued for accommodation, education buildings, retailers and the hospitality sector.
"Part of this speaks to the growth in the population and the need for more services," Mr Olsen says.
'There's growing demand for shops, bars, schools and accommodation because people are still spending here and visiting," says Brad.
'In this sense, it's the previous growth across the district that's now spurring this area of growth.”
This economic data helps with the work underway through our Council's Productivity Plan focused on high-value opportunites, with targeted workstreams in land use, land productivity, connected journeys, aquaculture, destination management and tourism.
Business attraction is a key focus of our Council's Economic Development Strategy and our team can help with contacts, networks and putting you in touch with potential investors.
Contact our Council's economic development team on 07 868 0200 or email [email protected]
At a glance - Coromandel Quarterly Economic Monitor September 2019
Key figures:
GDP: +1.4% ($1,079 million)
Traffic flows: +2.6%
Health enrolments: +1.4%
House sales: +0.8%
Residential consents: +2.6%
Non residential consents: 26.4%
Guest nights: +6.4%
Tourism expenditure: +9.7%
Jobseeker support recipients: +7.3%
Unemployment rate: 2.5%
If you want to find out more details on the latest economic quarterly data for the district go to the council website page here.
Read more about the Council's Economic Development Strategy 'Towards 2028' here:

0 comments
Leave a Comment
You must be logged in to make a comment.