
Northland, Waikato, and Bay of Plenty were the fastest-growing regions in the year ended June 30 2019, while the West Coast only had a small increase, says Stats NZ.
The provisional estimated resident population of all 16 regions and most territorial authority areas grew in the year ended 30 June 2019.
Five regions had growth greater than the national average of 1.6 per cent in the year ended June 30 2019:
- Northland (2.3 per cent)
- Waikato (2.1 per cent)
- Bay of Plenty (2.0 per cent)
- Canterbury (1.8 per cent)
- Otago (1.7 per cent).
Five regions grew less than one per cent: Nelson and the West Coast grew 0.98 and 0.2 per cent, respectively, with Gisborne, Marlborough, and Southland all growing 0.8 per cent. New Zealand's largest region, Auckland, grew 1.5 per cent, just below the national average.
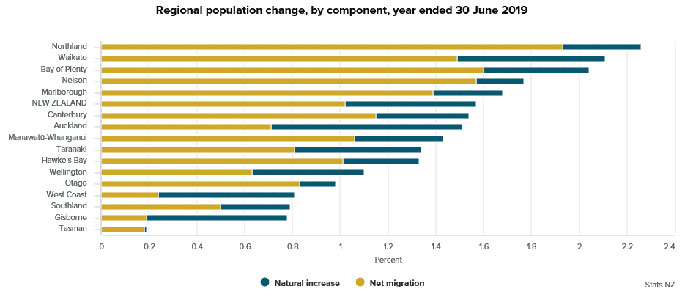
'This year, net migration contributed two-thirds of New Zealand's population growth with natural increase contributing the remaining one-third,” says population insights senior manager Brooke Theyers.
'Net migration remains the largest component of growth across most of New Zealand, and that reflects the national trend.”
Net migration reflects both people moving from one part of the country to another (internal migration) and people migrating in and out of New Zealand (external migration).
While both the North and South islands had overall growth similar to the national average of 1.6 per cent, there were a range of growth rates across the territorial authority areas within each island.
For example, in the South Island, the Selwyn district had a 5.3 per cent increase with Buller district declining by 0.3 percent in the June year.
In the North Island, Waikato district had a 2.8 per cent increase, while Waitomo district had an 0.9 per cent decrease in population over the same period.
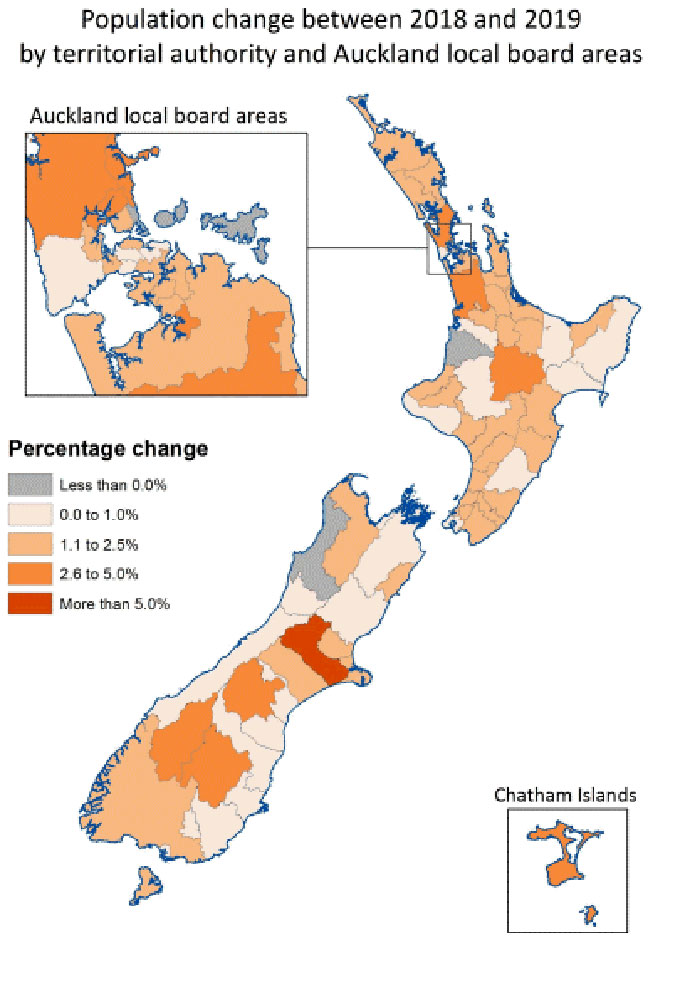
See Estimated annual population change by territorial authority year to 30 June 2019 – map data for the figures on this map.
These subnational population estimates supplement the national population estimates at 30 June 2019.
They now incorporate the new outcomes-based migration measure, and also reflect population distributions in the 2018 Census population, although they are still based on the 2013 Census usually resident population count.
Population estimates are always higher than census counts because they include people who are not counted in the census, such as residents temporarily overseas.
See Expected updates for population statistics 2019-20 for more information.
Population estimates incorporating 2018 Census results and estimates of census coverage (net census undercount) from the 2018 post-enumeration survey will be available on 30 March 2020.
Median age differs by over 20 years across territorial authorities
Median age across New Zealand's 67 territorial authority areas range from 32.3 years (Hamilton city) to 54.0 years (Thames-Coromandel district).
In 12 territorial authority areas (including all main cities)the median age is lower than the national median of 37.4 years at 30 June 2019.
'The median age is the age where half the population are younger, and half are older than this age."
A lower median age can be influenced by factors such as a higher share of children (aged under 15 years), or a tertiary facility (university or polytech) which can draw young adults (aged 15–29 years) to an area. This can be seen in territorial authority areas such as Porirua, Hamilton, and Wellington.
Areas with older median ages tend to have a higher proportion of people aged 65+ and, as a result, are likely to have more deaths.
In the June 2019 year, the areas with the largest proportions of people aged 65+ were Thames-Coromandel and Kapiti Coast districts, and both had natural decreases (more deaths than births).
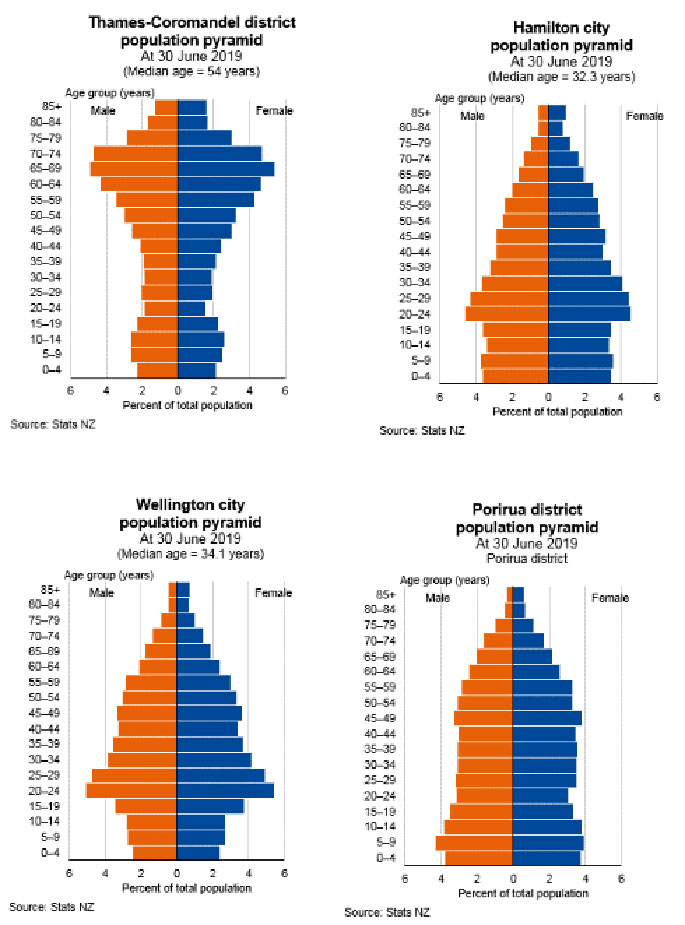
Text alternative for Thames-Coromandel district, Hamilton city, Wellington city, and Porirua district estimated population at 30 June 2019
Four population pyramids show the distribution of five-year age groups in the Thames-Coromandel district, Hamilton, Wellington, and Porirua districts at June 30 2019 (measured as a percentage of the total population).
Males are shown on the left and females on the right.
The graphs show that the largest proportion of both males and females in the Thames-Coromandel district are in the 65–69-year age group.
In Hamilton city the largest proportions of both males and female are in the 20–24-year age group with almost four per cent in both the age groups 0–4 and 5–9 years.
For Wellington city the largest proportion of both males and females are in the 20–24-year age group but only about 2.5 per cent are in the age groups 0–4 and 5–9 years.
Porirua city shows the largest proportions of both males and females are in the 5–9-year age group.

0 comments
Leave a Comment
You must be logged in to make a comment.