|
Weather Eye with John Maunder |
The National Snow and Ice Data Centre, in Boulder, Colorado, has an extensive website on Arctic and Antarctic sea ice. (see http://nsidc.org/data/seaice_)
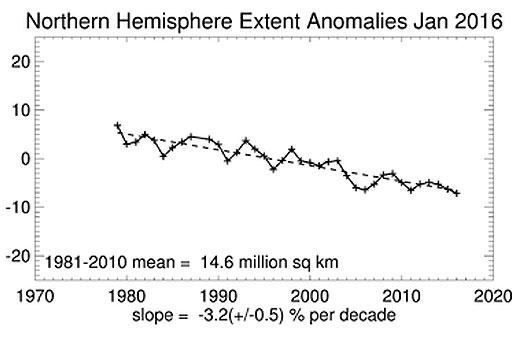
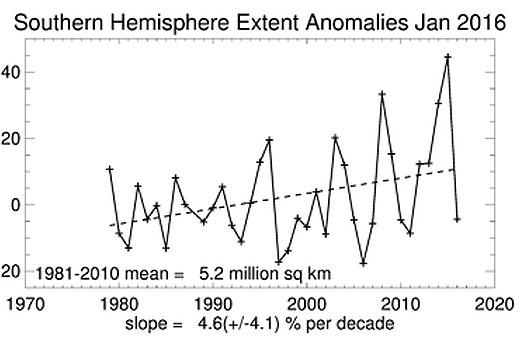
Graphs of the extent of the Northern Hemisphere and Southern Hemisphere ice – updated to December 2015 – from the above website are shown below.
These show from 1979 to 2015 the Northern Hemisphere ice extent decreased at the rate of 3.4 per cent per decade, compared with an increase of 2.2 per cent per decade during the same period in the Southern Hemisphere.
The end of 2015 finished with the Arctic sea ice extent tracking between one and two standard deviations below average, as it did throughout the autumn.
This caps a year that saw the lowest sea ice maximum in February, and the fourth lowest minimum in September.
In Antarctica, December 2015 sea ice extent was slightly above average, but far below the exceptionally large ice extents recorded for December 2013 and 2014.
A slow-down in the rate of Antarctic sea ice growth in July was followed by near-average extents in the subsequent months
The year 2015 will be remembered for three major events in sea ice extent: the lowest Arctic maximum in the satellite record, the fourth lowest Arctic minimum in the satellite record.
From February 2013 through June 2015, Antarctic sea ice was at record or near-record daily extents.
Antarctic sea ice set consecutive record winter maxima in 2012, 2013 and 2014.
(Contrary to 2013 and 2014, autumn and spring conditions in 2012 were near-average.) But during this year's mid-winter period, Antarctic sea ice growth slowed.
Since then, extent in the Southern Hemisphere has generally been slightly above average levels for Antarctic sea ice extent after more than two years of record and near-record highs.