|
Weather Eye with John Maunder |
The Southern Oscillation Index (SOI) is a standardized index based on the observed sea level pressure differences between Tahiti and Darwin, Australia. The SOI is a leading measure of the large-scale fluctuations in air pressure occurring between the western and eastern tropical Pacific (i.e., the state of the Southern Oscillation) during El Niño and La Niña episodes. In general, smoothed time series of the SOI correspond very well with changes in ocean temperatures across the eastern tropical Pacific.
The negative phase of the SOI represents below-normal air pressure at Tahiti and above-normal air pressure at Darwin.
The positive phase of the SOI represents above-normal air pressure at Tahiti and below-normal air pressure at Darwin.
Prolonged periods of negative SOI values coincide with abnormally warm ocean waters across the eastern tropical Pacific typical of El Niño episodes.
In contrast, prolonged periods of positive SOI values coincide with abnormally cold ocean waters across the eastern tropical Pacific typical of La Niña episodes.
Sustained negative values of the SOI below −8 often indicate El Niño episodes. These negative values are usually accompanied by sustained warming of the central and eastern tropical Pacific Ocean, a decrease in the strength of the Pacific Trade Winds.
Sustained positive values of the SOI above +8 are typical of a La Niña episode. They are associated with stronger Pacific trade winds and warmer sea temperatures to the north of Australia. Waters in the central and eastern tropical Pacific Ocean become cooler during this time.
The graph below shows monthly values of the SOI in recent years updated to October 2015. As shown we are currently in a significant El Nino episode..
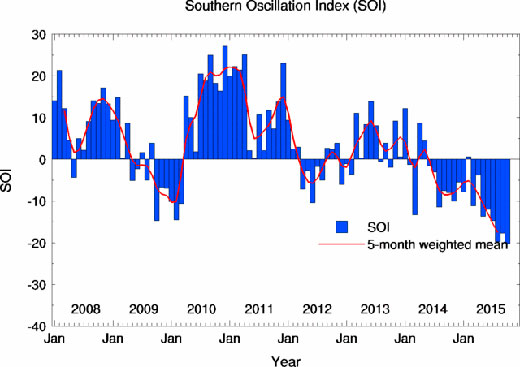
Source : Bureau of Meteorology, Australia
For further information on weather and climate matters see: https://sites.google.com/site/climatediceandthebutterfly/