|
Weather Eye with John Maunder |
Global temperatures are compiled for various areas including global (land-ocean), global (meteorological stations), three latitude bands, and hemispheric, by the Goddard Institute for Space Studies of NASA.
A graph of the global temperatures since 1890 shows a general warming from 1910 to the early ‘40s, a cooling from the early ‘40s to the mid ‘70s, and a general warming from the mid ‘70s to about 2000. However since then, global monthly temperatures have been relatively steady with no real cooling or warming.
The yearly global temperatures (expressed as differences from the 1951-80 average) since 1998 are: 1998, +0.58 degrees; 1999, +0.33; 2000, +0.35; 2001, +0.48; 2002, +0.56; 2003, +0.56; 2004, +0.49; 2005, +0.62; 2006, +0.55; 2007 +0.58; 2008, +0.44, 2009, +0.57 ; 2010, +0.63 ; and 2011, +0.51 degrees.
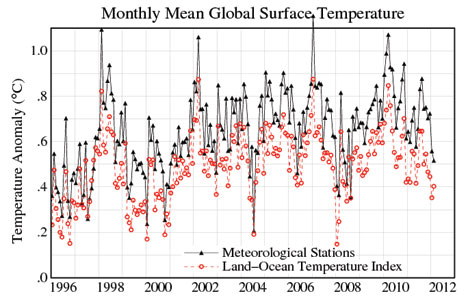
The graph shows the monthly mean global surface temperature anomaly from the base period 1951-1980. The black line shows meteorological stations only; the dotted line is the land-ocean temperature index obtained from satellite measurements.