
Despite more real estate signs popping up on Bay of Plenty lawns property values remain static, according to a local QV valuer.
The latest QV Quarterly Property Report shows the average values of Tauranga and Western Bay properties have increased by 0.3 per cent in the last 12 months.
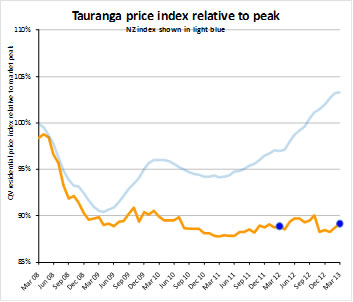
Tauranga's average value of residential properties is $428,273, a 0.8 per cent increase during the last three months.
'But during the last 12 months the value has only increased by 0.3 per cent - so it is pretty subdued,” says Tauranga QV valuer Paul Thomas .
'We're seeing a lot more real estate signs going up and we're hearing of homes being sold which suggests that the volume of sales has gone up but we haven't seen that translate in the value of properties.”
He says the noticed flurry of activity is due to low interest rates enabling people to get back into the market, or allowing first-home buyers to enter, 'which is good but it hasn't seen extra demand push up values”.
The Western Bay has seen a 4.7 per cent increase in property value during the last 12 months but Paul says could be due to previous low values making the jump look a little bit more dramatic with the last quarter increase being only 1.3 per cent.
The region's current average value for residential properties is $404,747 and it is also well below (-11.1 per cent) the 2007 market peak.
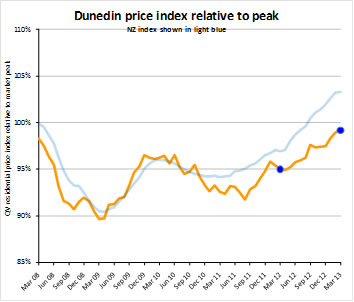
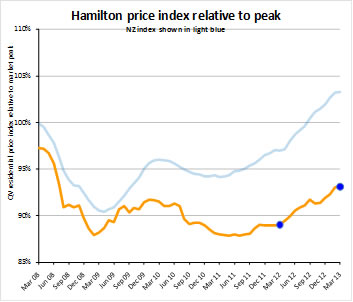
Nationwide, the survey suggests that values are still increasing but there are signs that the rate of increase has slowed in the last month or two in Auckland, Hamilton, Christchurch and Dunedin.
'Most increases have been centred in Auckland and Christchurch and while some people think that we are now heading for another bubble this is isolated because Hamilton and Tauranga is only tracking along – we've been sitting around the $420,000 value mark for a year or two - our market has been quite slack since 2009,” says Paul.
The report says Tauranga's average property value is well below (-10.8 per cent) the market peak of 2007 but Paul says this does not mean it is a buyer's market.
'Either way a lot of sellers are quite happy to hang onto properties as well because interest rates are low and there is no extra demand to get buyers pushing up values,” says Paul.
But if sellers cannot keep hold of their 2007 purchases, it looks likely they would lose money by selling now.
'I would think most people who bought property in 2007 would be looking at some sort of loss unless they've added value to property.
'But if you can ride it out I think the market is correcting itself in Tauranga – the average property value is still quite high at $428,000 compared to average property values of Wellington ($442,206) and Christchurch ($413,801),” says Paul.
'We've had quite a high average house price – it would seem it is correcting itself for the time being.”
Paul says Tauranga is set to see a lot of development happen in the next five years.
'But we need more jobs and the economy to grow at a faster rate to see extra demand for people translate to demand for property and values to go up again.”
|
Territorial authority |
Average current value |
12 month change% |
3 month change % |
Since 2007 market peak change % |
|
Western BOP |
404,747 |
4.7% |
1.3% |
-11.1% |
|
Tauranga |
428,273 |
0.3% |
0.8% |
-10.8% |
|
Rotorua |
270,801 |
0.6% |
0.5% |
-12.8% |
Signs that main centres may be slowing
The latest monthly property value index shows that nationwide residential values increased further in March. Values are up 3.3% above the previous market peak of late 2007, with a 1.3% increase over the past three months and a 6.5% increase over the past year.

Jonno Ingerson, QV.co.nz Research Director said 'nationwide values are still increasing although there are signs that the rate of increase has slowed in the last month or two in Auckland, Hamilton, Christchurch and Dunedin. However it is still too early to tell if this is the start of a more widespread slowing of values”.
'The provincial centres remain variable with no universal trends evident either over the past three months or the past year” said Ingerson.
'The number of properties on the market remains limited, particularly in Auckland. This has constrained the number of sales at a time when buyers have generally shown more confidence and have been keen to purchase” said Ingerson.
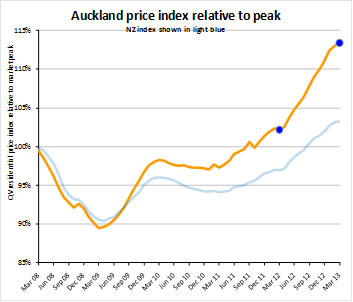
Auckland
Values across Auckland are still increasing and are now up 11.0% over the past year. Areas like Rodney and old Auckland City continue to show slower rates of growth over the past 3 months than what has previously been seen and in comparison to other areas. Overall, values are still markedly above last year, with North Shore seeing the greatest increase at 11.6%.
QV Operations Manager Kerry Stewart said 'We have seen a continued lack of listings, and this has worsened over the past month as people start to hold onto their properties more, especially in the wake of the release of the draft unitary plan. Many buyers are also starting to feel that house prices are unreasonable and are waiting it out to see if houses become more affordable.”
'Auctions are still popular especially in the inner city where the market remains heated. In general the right properties will still go at the right price,” said Stewart.
Other main centres
Outside of Auckland, the main cities are continuing to increase, although some at a greater rate than others. Hamilton has grown slightly with a 1.3% change over the past 3 months; however it is still sitting at 4.6% up on last year.
Tauranga continues to fluctuate, although within a narrow range. It is 0.8% up over the past 3 months, meaning only a 0.3% increase on this time last year.
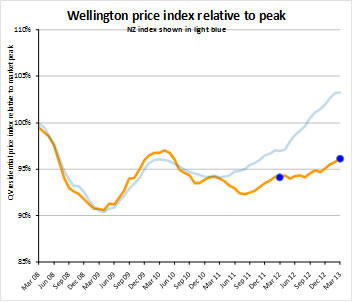
Values in the Wellington area have continued to steadily increase since November after being relatively steady for most of 2012. Values there are now 2.1% above this time last year.
QV Valuer Pieter Geill said 'although busy, the market has been relatively unpredictable with houses that were expected to sell quickly sticking around for longer. Houses priced too high, or perceived as quirky or in need of renovation appear to be putting younger buyers off”.
'Houses around the $300,000 mark are selling quickly in the Hutt Valley, with many buyers tapping into the KiwiSaver first home deposit subsidy, which in the Hutt Valley is capped at house and land packages valued at $300,000. In Wellington City there has been good activity around properties in the $1-1.3 million bracket as well as entry level homes around $450,000. The apartment market is slow at present” said Pieter Geill.
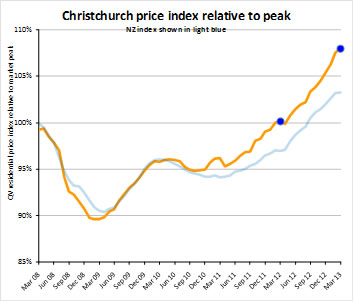
Christchurch values remains significantly above last year with a 7.8% increase. The outlying areas such as Waimakariri and Selwyn continue to hold their value although the increase in value in recent months has been slower than what we have seen previously.
QV Valuer Daryl Taggart said 'values in Christchurch have again stayed strong compared to last year with the demand for housing. The market is still quite strategic with vendors not wanting to show their hand too much if they can help it. The outlying areas appear to be not selling like they used to but could see slight lifts again in the future.”
Dunedin has seen a 1.7% increase over the past 3 months, leaving it 4.4% up on last year.
Provincial centres
The main provincial centres are still experiencing increases in values, albeit at different rates around the country. Some areas where values have previously been faltering, such as Rotorua (up 0.5% over the past 3 months) and Gisborne (up 1.9% over the past 3 months) have also seen a turn around and are now experiencing increases. Whangarei continues to buck the trend, with a 0.9% decrease over the past 3 months.
For media enquiries and interviews, and for further information contact:
Jonno Ingerson
Research Director QV.co.nz
Tel: 04 802 1239
Mobile: 027 454 6642
Email: jonno.ingerson@propertyiq.co.nz
For further specific comment on local areas:
Auckland. Kerry Stewart 021 387 106
Hamilton. Richard Allen 027 230 7290
Tauranga. Paul Thomas 027 544 4602
Wellington. Pieter Geill 027 230 7291
Christchurch. Daryl Taggart 027 304 9815
Dunedin. Tim Gibson 021 151 2887
|
PropertyIQ Value Index - Residential Property |
|
|
|
||
|
|
|
|
|
|
|
|
Time period: as at March 2013 |
|
|
|
|
|
|
|
|
|
|
|
|
|
|
Territorial authority |
Average current value |
12 month change% |
3 month change % |
Since 2007 market peak change % |
|
|
Far North |
306,736 |
0.5% |
-3.5% |
-24.8% |
|
|
Whangarei |
322,963 |
-1.8% |
-0.9% |
-18.4% |
|
|
Kaipara |
304,564 |
-2.7% |
-0.9% |
-24.0% |
|
|
Auckland - Rodney |
590,180 |
8.0% |
1.6% |
-0.3% |
|
|
Hibiscus Coast |
589,687 |
9.6% |
1.8% |
0.4% |
|
|
Rodney (North) |
591,344 |
6.2% |
1.8% |
-1.5% |
|
#A |
Auckland - North Shore |
720,434 |
11.6% |
2.4% |
12.3% |
|
|
Coastal North Shore |
826,775 |
11.0% |
2.4% |
9.7% |
|
|
North Shore Onewa |
571,956 |
12.4% |
1.7% |
15.3% |
|
|
North Harbour |
700,994 |
12.0% |
3.6% |
15.4% |
|
#A |
Auckland - Waitakere |
465,999 |
10.8% |
2.7% |
9.4% |
|
#A |
Auckland - City |
726,601 |
11.2% |
1.6% |
16.5% |
|
|
Auckland City (Central) |
659,888 |
12.2% |
1.9% |
15.9% |
|
|
Auckland City (East) |
901,350 |
9.7% |
1.8% |
13.1% |
|
|
Auckland City (South) |
643,464 |
12.6% |
1.5% |
19.5% |
|
|
Islands |
665,141 |
4.6% |
1.8% |
4.0% |
|
#A |
Auckland - Manukau |
505,501 |
10.5% |
2.2% |
10.0% |
|
|
Manukau East |
674,647 |
10.6% |
1.4% |
13.2% |
|
|
Manukau Central |
387,825 |
10.4% |
3.4% |
3.2% |
|
|
Manukau North West |
409,610 |
11.0% |
2.2% |
10.9% |
|
#A |
Auckland - Papakura |
371,732 |
7.5% |
3.1% |
3.4% |
|
|
Auckland - Franklin |
402,992 |
5.1% |
0.3% |
-0.6% |
|
|
Thames Coromandel |
481,873 |
-1.5% |
-3.2% |
-17.7% |
|
|
Hauraki |
239,984 |
0.2% |
0.2% |
-15.9% |
|
|
Waikato |
270,672 |
5.9% |
2.3% |
-16.5% |
|
|
Matamata Piako |
257,948 |
1.8% |
-2.1% |
-13.9% |
|
# |
Hamilton |
344,719 |
4.6% |
1.3% |
-6.9% |
|
|
Hamilton North East |
424,496 |
4.1% |
0.6% |
-5.6% |
|
|
Central City/North West |
324,172 |
3.0% |
1.2% |
-9.4% |
|
|
Hamilton South East |
323,205 |
4.8% |
2.1% |
-7.5% |
|
|
Hamilton South West |
310,399 |
4.1% |
1.3% |
-9.3% |
|
|
Waipa |
321,870 |
4.9% |
1.4% |
-4.8% |
|
|
Otorohanga |
N/A |
N/A |
N/A |
N/A |
|
|
South Waikato |
127,545 |
-4.3% |
-6.0% |
-21.9% |
|
|
Waitomo |
N/A |
N/A |
N/A |
N/A |
|
|
Taupo |
348,100 |
0.3% |
-1.2% |
-14.2% |
|
|
Western BOP |
404,747 |
4.7% |
1.3% |
-11.1% |
|
# |
Tauranga |
428,273 |
0.3% |
0.8% |
-10.8% |
|
|
Rotorua |
270,801 |
0.6% |
0.5% |
-12.8% |
|
|
Whakatane |
295,402 |
3.2% |
-0.1% |
-14.9% |
|
|
Kawerau |
N/A |
N/A |
N/A |
N/A |
|
|
Opotiki |
N/A |
N/A |
N/A |
N/A |
|
|
Gisborne |
226,420 |
-2.5% |
1.9% |
-25.1% |
|
|
Wairoa |
N/A |
N/A |
N/A |
N/A |
|
|
Hastings |
296,671 |
3.3% |
1.5% |
-5.6% |
|
# |
Napier |
317,666 |
1.2% |
0.3% |
-7.0% |
|
|
Central Hawkes Bay |
213,914 |
0.5% |
2.0% |
-20.2% |
|
|
New Plymouth |
329,690 |
4.1% |
2.4% |
-1.4% |
|
|
Stratford |
193,995 |
-1.3% |
0.8% |
-10.8% |
|
|
South Taranaki |
174,361 |
-5.0% |
-5.5% |
-12.2% |
|
|
Ruapehu |
138,754 |
-4.0% |
-3.0% |
-23.5% |
|
|
Wanganui |
187,905 |
-0.1% |
-1.8% |
-14.3% |
|
|
Rangitikei |
148,157 |
-2.0% |
-0.6% |
-17.6% |
|
|
Manawatu |
239,327 |
4.1% |
3.6% |
-5.8% |
|
# |
Palmerston North |
284,033 |
2.8% |
0.3% |
-5.5% |
|
|
Tararua |
157,228 |
4.2% |
5.3% |
-9.8% |
|
|
Horowhenua |
199,360 |
-1.0% |
1.1% |
-16.6% |
|
|
Kapiti Coast |
363,887 |
1.5% |
1.1% |
-5.2% |
|
#W |
Porirua |
373,509 |
2.5% |
1.1% |
-2.5% |
|
#W |
Upper Hutt |
331,936 |
2.1% |
2.1% |
-6.5% |
|
#W |
Hutt |
363,447 |
0.8% |
0.0% |
-8.4% |
|
#W |
Wellington |
523,347 |
2.5% |
1.3% |
-2.6% |
|
|
Wellington City & Southern Suburbs |
530,040 |
1.4% |
1.4% |
-5.4% |
|
|
Eastern Suburbs |
572,724 |
3.8% |
2.5% |
-0.6% |
|
|
North Wellington |
457,362 |
2.1% |
0.5% |
-1.9% |
|
|
Western Suburbs |
598,532 |
2.6% |
1.5% |
-1.5% |
|
|
Masterton |
236,565 |
-0.8% |
0.5% |
-18.2% |
|
|
Carterton |
255,224 |
5.5% |
4.1% |
-7.6% |
|
|
South Wairarapa |
287,529 |
0.8% |
1.0% |
-16.1% |
|
|
Tasman |
400,784 |
2.9% |
1.2% |
0.6% |
|
# |
Nelson |
389,939 |
2.8% |
0.3% |
2.1% |
|
|
Marlborough |
340,476 |
3.2% |
0.9% |
-12.8% |
|
|
Kaikoura |
340,178 |
3.2% |
-3.4% |
-22.3% |
|
|
Buller |
223,126 |
5.9% |
1.3% |
7.5% |
|
|
Grey |
219,722 |
4.0% |
-0.1% |
-8.9% |
|
|
Westland |
217,443 |
-0.9% |
0.2% |
-12.4% |
|
|
Hurunui |
325,349 |
6.2% |
0.7% |
2.8% |
|
|
Waimakariri |
370,352 |
7.6% |
1.1% |
16.2% |
|
# |
Christchurch |
413,801 |
7.8% |
2.4% |
8.0% |
|
|
East |
320,900 |
6.9% |
2.8% |
3.7% |
|
|
Hills |
585,780 |
10.2% |
2.9% |
5.9% |
|
|
Central City and North |
476,050 |
8.3% |
2.2% |
7.5% |
|
|
Southwest |
381,780 |
9.4% |
2.5% |
12.5% |
|
|
Banks Peninsula |
473,484 |
5.0% |
2.3% |
-1.4% |
|
|
Selwyn |
450,981 |
12.0% |
2.2% |
19.5% |
|
|
Ashburton |
295,713 |
9.6% |
1.5% |
5.5% |
|
|
Timaru |
262,869 |
5.4% |
0.6% |
4.0% |
|
|
MacKenzie |
273,182 |
0.7% |
2.6% |
-7.6% |
|
|
Waimate |
184,924 |
5.8% |
6.8% |
-3.5% |
|
|
Waitaki |
215,354 |
1.5% |
-0.3% |
-5.8% |
|
|
Central Otago |
293,546 |
1.1% |
-1.0% |
-7.6% |
|
|
Queenstown Lakes |
627,470 |
5.1% |
1.9% |
-12.2% |
|
# |
Dunedin |
284,351 |
4.4% |
1.7% |
-0.8% |
|
|
Central/Northern City |
291,696 |
3.4% |
0.6% |
-3.3% |
|
|
Peninsula/Coastal Dunedin |
255,949 |
0.6% |
-0.6% |
-5.5% |
|
|
Southern City |
278,276 |
6.3% |
4.0% |
-2.5% |
|
|
Taieri |
294,114 |
6.0% |
2.6% |
0.1% |
|
|
Clutha |
167,083 |
3.6% |
5.4% |
-7.9% |
|
|
Southland |
206,873 |
-3.4% |
2.3% |
-11.1% |
|
|
Gore |
183,700 |
2.3% |
2.3% |
3.9% |
|
# |
Invercargill |
208,305 |
1.9% |
1.3% |
-7.1% |
|
|
|
|
|
|
|
|
|
Auckland Area |
620,605 |
11.0% |
2.0% |
13.4% |
|
|
Wellington Area |
442,206 |
2.1% |
1.1% |
-3.9% |
|
# |
Main Urban Areas |
491,124 |
8.0% |
1.7% |
7.1% |
|
|
Total NZ |
429,061 |
6.5% |
1.3% |
3.3% |
|
|
|
|
|
|
|
|
Notes on the above data: |
|
|
|
|
|
|
1. The information included in the above table is based on the monthly property value index. This index is calculated based on the sales data entered into PropertyIQ's system in the previous 3 month period. For example, information for the period ending June will be calculated based on sales entered between April 1 and June 30. |
|||||
|
2. The average current value is the average (mean) value of all developed residential properties in the area based on the latest index. It is not an average or median sales price, as both of those only measure what happens to have sold in the period. |
|||||
|
3. The percentage change over three months, twelve months and since the 2007 market peak are based on the change in the property value index between that time and the current. |
|||||
|
4. Any of the statistical data shown in italics are calculated based on a sample set of data that is less than the recommended minimum. These results should be used with caution. Those showing N/A had too few sales to generate an index |
|||||

0 comments
Leave a Comment
You must be logged in to make a comment.